[R8I8]
This paper proposes an interesting and potentially important extension to representational similarity analysis (RSA), which promises unbiased estimates of response-pattern similarities and more compelling comparisons of representations between different brain regions.
RSA consists in the analysis of the similarity structure of the representations of different stimuli (or mental states associated with different tasks) in a region of interest (ROI). To this end, the similarity of regional response patterns elicited by the different stimuli is estimated, typically by using their linear correlation coefficient across voxels (or neurons or recording sites in electrophysiology). It is often desirable to be able to compare these pattern similarities between different regions. For example, we would like to be able to address whether stimuli A and B elicit more highly correlated response patterns in region 1 or region 2. However, such comparisons are problematic, because the pattern correlations depend on fMRI noise (which might be different between the regions), voxel selection (e.g. selecting additional noisy voxels will reduce the pattern correlation), and unspecific pattern components (e.g. a strong shared component between all stimuli will increase the pattern correlation, with the high correlation not specific to the particular pair of stimuli).
When representational dissimilarities (or, equivalently similarities) are estimated from estimates of response patterns in a multidimensional space, the dissimilarity estimates are positively (or the similarity estimates negatively) biased. This is because the inevitable noise affecting the pattern estimates will typically increase the apparent distance between any two patterns (the probability of a decrease of the distance due to noise is 0.5 in 1 dimension and drops rapidly as dimensionality increases).
Instead of estimating the distances from pattern estimates, the authors therefore propose to estimate the distances from a covariance component model that captures the pattern variances and covariances across space. The approach requires that each stimulus (or, more generally, each experimental condition) has been repeated multiple times to yield multiple pattern estimates. Whereas simple RSA would consider the average pattern for each stimulus, the authors’ approach models the original trial-by-voxel matrix Y as a linear combination of a set of stimulus-related patterns U (thought to underlie the observed patterns) and noise, and estimates the covariance structure of the patterns. The noise E is assumed to be independent between trials, but there is no assumption of independence of the noise between voxels. This is important because fMRI error time series from voxels closeby within a region are known to be correlated.
This is an original and potentially important contribution. The core mathematical model appears well developed. The demonstration of the advantages of the method is compellingly demonstrated based on simulated data. The paper is well written. However, it requires a number of improvements to ensure that it successfully communicates its important message. (1) The authors should more clearly explain the assumptions their pattern-covariance modelling approach relies upon. (2) The authors should add a section explaining the practical application of the approach (3) A number of clarifications and didactical improvements, notably to the presentation of the analysis of the real fMRI data, would be desirable. These three major points are explained in detail below.
[This is my original secret peer review of Diedrichsen et al. (2011). Most of the suggestions for improvements were addressed in revision and are no longer relevant.]
MAJOR POINTS
(1) Assumptions and consequences of violations
The advantages of pattern-covariance modeling are well explained. However, the assumptions of this approach should be more clearly communicated, perhaps in a separate section.
- Does the validity of the approach depend on assumptions about the probability densities of the response amplitudes? Are there any other assumptions about the nature of the response patterns?
- What are the effects of violations of the assumptions? Please give examples of cases where the assumptions are violated and describe the expected effects on the analysis.
- As long as statistical inference is performed at the level of the variability across subjects or by using randomisation testing, results might be robust to certain violations. Please clarify if and when this is the case.
(2) Practical application of the new approach
Please add a section explaining how to apply this method to fMRI data, addressing the following questions:
- Do the authors plan to make matlab code available for the new method? If so, it would be good to state this in the paper.
- Is there a function that takes the regional data matrix Y, the design matrix Z (including effects of no interest) and perhaps a predictor selection vector for selecting effects of interest as input and returns the corrected correlation (and perhaps Euclidean) distance matrix?
- Does the method only work with slow event-related designs (with approximately independent trial estimates)?
- Can we use the method on rapid-event-related designs where we do not have separate single-trial estimates (because single-trial responses overlap in time and multiple trials of the same condition must be estimated together for stability)?
- What if we have only one pattern estimate per condition, because our design is condition-rich (e.g. 96 conditions as in Kriegeskorte et al. 2008) and rapid-event related?
- More generally, what are the requirements and limitations of the proposed approach?
(3) Particular clarifications and didactical improvements
In classical multivariate regression, we get an estimate of the error of a spatial response pattern estimate as a multinormal (characterised by a scaled version of the voxel-by-voxel covariance matrix of the residuals, where the scaling factor reflects the amount of averaging for the case of binary nonoverlapping predictors, and, more generally, the sums of squares and products of the design matrix). Couldn’t this multinormal model of the variability of each condition-related pattern estimate be used to get an unbiased estimate of the correlation of each pair of pattern estimates? If so, would this approach be inferior or superior to the proposed method, and why?
- 7: What exactly are the ‘simplifying assumptions’ that allow a to be estimated independently of G by averaging the trial response patterns within conditions?
“The corrected estimate from the covariance-component model is unbiased over a large range of parameter settings.” What are the limits of this range? Is the estimate formally unbiased or just approximately so?
Can question a) “Does the region encode information about the finger in the movement and/or stimulation condition?” be addressed with the traditional and the proposed RSA method? It seems that that would necessitate estimating the replicability of patterns elicited by moving the same finger (and similarly for sensation). It is a typical and important neuroscientific question, so please consider addressing in the framework of RSA (not just in terms of a possible classifier analysis as in the current draft).
Across different runs, pattern correlations are usually found to be much lower (e.g. Misaki et al. 2010). This phenomenon requires further investigation. The authors suggest error correlations among trials closeby in time within a run as the cause. However, I suspect that such error correlations, though clearly present, might not be the major cause of this. Other causes include scanner drifts and greater head-motion-related disalignment (due to greater separation in time), which can cause distortions, that head-motion-correction cannot undo. It would be good to hear the authors’ assessment of these alternative causes.
The notation u_beta[c,1,…4], where c is an element of {1,2} is confusing to me. Shouldn’t it be u_beta[c,d], where c is an element of {1,2}, and d is an element of {1,2,3,4}?
Eq. 8 requires more unpacking. Perhaps a figure with the vertical and horizontal dimensions marked (“task effects: movement vs sensation”, “individual finger effects: (1) movement, (2) sensation”) and arrows pointing from conceptual labels (“shared pattern between all movement trials”, “shared pattern between all sensation trials”, etc.) to the variance components could serve this function.
Figures 1-4 are great.
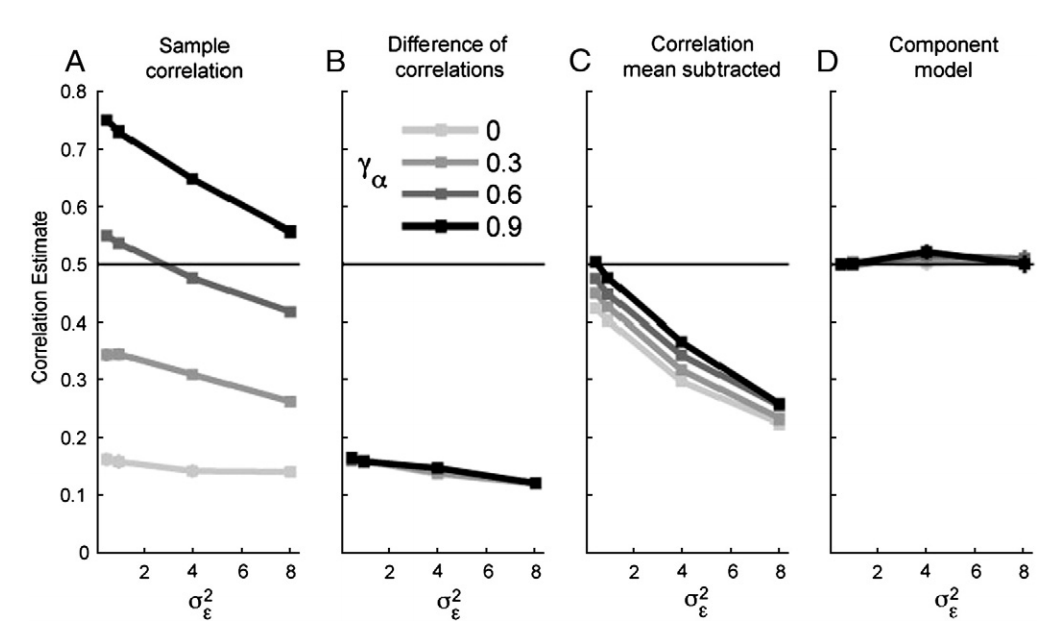
Figures 6 and 7: This comparison between traditional RSA and the proposed method is not completely successful. Figure 6 the traditional approach is very comprehensible. Figure 7 is cryptic (partly due to lack of meaningful labeling of the vertical axes). Moreover, the relationship between the traditional and the proposed approach to RSA remains unclear (or anyway difficult to grasp at a glance). I suggest adding a figure that compares traditional RSA and the proposed method side by side. The top row should show the correlation matrices (sample correlation versus unbiased estimates from covariance component model). The next three rows should address the three questions raised in the text: “a) Does the region encode information about the finger in the movement and/or stimulation condition? b) Are the patterns evoked by movement of a given finger similar to the patterns evoked by stimulation of the same finger? c) Is this similarity greater in one region than another?” Results from the traditional and the proposed RSA should be shown for each question to demonstrate how the results appear in both approaches and where the traditional approach falls short.
MINOR POINTS
In Eq. 8, u_beta[1,2] should read u_beta[1,1], I think.
“The decomposition method offers an elegant way to control for all these possible influences on the size of the correlation coefficients. In addition to noise (ε), condition ( , ), and finger ( , ) effects (Eq. 7), we also added a run effect.” Should say Eq. 8, I think.
Does U stand for ‘(u)nderlying patters’ and a for spatial-average (a)ctivation? It would help to make this explicit.
Figure 6 : Please label the vertical axes (intuitive and clear conceptual label). Please mark all significant effects. Please add a colorbar (grayscale code for correlation). Legend: “(D) These correlations” Which correlations exactly? (Averaged across sense and move now?)
Figure 7: The vertical axes need to be intuitively labeled. The reader should not have to decode mathematical symbols from the legend to understand the meaning of the bar graphs. Even after a careful read of the legend (and after spending quite a bit of time on the paper), the neuroscientific findings are not easy to grasp here. As a result, the present version of this figure will leave readers preferring traditional RSA (Figure 6) as it at least can be interpreted without much effort. Please label gray and white (“sense” and “move”) bars as in Figure 6.
