Wang et al. (pp2020) offer an exciting concise review of the substantial progress with brain connectomes over the past decade. Better methods and bigger studies using retrograde and anterograde tracers in mouse, marmoset and macaque give a more detailed, more quantitative, and more comprehensive picture of brain connectivity at multiple scales in these species.
The review also describes how the new anatomical information about the connectivity is being used to build dynamic network models that are consistent with features of the dynamics measured with neurophysiological methods.
In 1991, Felleman and van Essen published a famous connectomic synthesis of reported results on connections between visual cortical areas in the macaque. In 2001, Stephan et al. published an updated inter-area cortical connectivity matrix in the macaque (CoCoMac). These studies presented summaries of the literature in the form of a matrix of inter-area connectivity, qualitatively assessed (as “absent”, “weak”, or “strong” in Stephan et al. 2001). Over the past two decades, tracer studies have provided quantitative results about directed connectivity. We now have comprehensive directed and weighted inter-area connection matrices, which give a better global picture of brain connectivity in macaque, marmoset, and mouse, although they don’t include all regions and are not cell-type specific.
Consider the following (non-exhaustive) list of three levels of connectomic description:
- full synaptic connectivity of the cellular circuit
(electron microscopy) - summary statistics of in inter-laminar directed connectivity between areas (tracer studies)
- summary statistics of global undirected inter-area connectivity
(noninvasive MR diffusion imaging with tractography analysis)
Only the first level defines a circuit in terms synaptic interactions between individual neurons that could conceivably be animated in a computer simulation to recover the information-processing function of the circuit. Such a bottom-up approach to understanding the computations in biological neural networks may eventually be feasible for worms, flies, and zebrafish. For rodents and primates, it is out of reach. The full cellular-level connectome is very difficult or even impossible to measure and would be unique to each individual animal. Moreover, even when we have it (as for C. elegans) and it is small enough for nimble simulations (300-400 neurons), it still not clear how to best use this information to understand the circuit’s computational function from the bottom up.
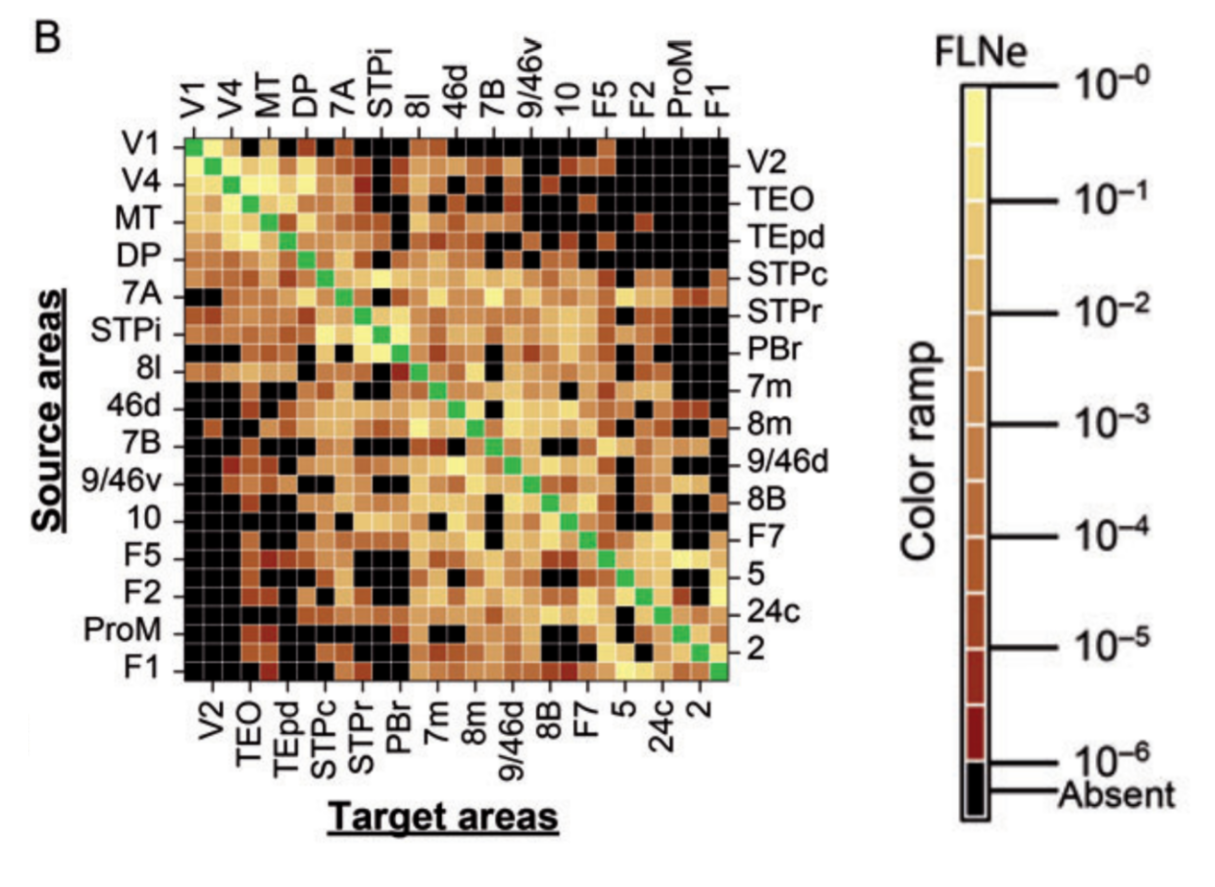
For rodents and primates, we must settle for statistical summaries and combine the data-driven bottom-up approach to understanding the brain with a computational-theory-driven top-down approach. The advances described by Wang et al. focus on the intermediate level 2. An important summary statistic at this level is the fraction of labeled neurons (FLN), which describes, for a retrograde tracer injected in a given region, in what proportions upstream regions contribute incoming axonal projections.
Several insights emerged from tracer-based connectivity:
- The strength of inter-area connectivity decays roughly exponentially with the areas’ distance in the brain.
- Some pairs of areas are connected, but very sparsely. Other pairs of areas have a massive tract of fibers between them. Connectivity strengths vary by five orders of magnitudes.
- The structural connectivity, in combination with a generic model of the excitatory/inhibitory local microcircuits, can be used as a basis for simulation of the network dynamics. The emergent dynamics is broadly consistent with neurophysiological observations, including slower, more integrative responses in regions further removed from the sensory input, which receive a larger proportion of their input through a broad distribution of paths through the network.
- Laminar origins of connections differ between feedforward and feedback connections. Feedforward connection tend to originate in supragranular and feedback connections in infragranular layers. Modeling superficial and deep layers with separate excitatory/inhibitory microcircuits and using lamina-specific connectivity enables modeling of more detailed hierarchical dynamics, including the association of gamma with feedforward signals and alpha/beta with feedback.
- A network model in which long-range excitation is tempered with local inhibition can explain threshold-dependent dynamics, where weak inputs fail to be propagated and inputs exceeding a threshold ignite a global response.
- When a brain is scaled up , the number of possible pairwise connections grows as the square of the number of units to be connected (e.g. neurons or areas, depending on the level at which connectivity is considered). Full connectivity, thus, is much less costly in a small brain. This means that connectivity and component placement are less constrained in a small brain. Consistently with this simple fact, the macaque brain has connections among about two thirds of all pairs of areas (half of them reciprocal), whereas the mouse brain has 97% of all possible inter-area connections. The marmoset, a much smaller primate, may have somewhat more widely distributed connectivity than the macaque, but not to the extent predicted by its smaller-scale brain. Its connectivity is in fact quite similar to that of the macaque. Species and scaling both seem to matter to the overall degree of inter-area connectivity.
These models take a bottom-up approach in which the structural constraints provided by the tracer studies and descriptions of the cortical microcircuit are used to simulate global activity dynamics. Aspects of these dynamics, such as longer timescales in higher regions are suggestive of computational functions like evidence integration. However, the models do not perform task-related information processing, and so do not explain any cognitive functions. What is still missing is the integration of the bottom-up approach to modeling with the top-down approach of deep recurrent neural networks, where parameters are optimized for a model to perform a nontrivial perceptual, cognitive, or motor control task.
Suggestions for improvements in case the paper is revised
The paper is well-written and engaging. It’s great that it links structure to dynamics and points toward links between structure and computational function, which remain to be elaborated over the next decade. My main suggestion is to slightly expand this very concise piece with a view to (a) clarifying things that are currently a little too dense and (b) adding some elements that would make the paper even more useful to its readers.
Useful additions to consider include:
- A table that compares the different available connectomic datasets in terms of the information provided and the information missing, and links to open-science resources to help neuroscientists use of the structural constraints for theory and modeling of function.
- An update to the famous Felleman and van Essen (1991) diagram, with area sizes and directed, weighted connections. This seems very important for the field to have. Is it already available or can it be constructed with relative ease, at least for a subset of the regions, e.g. the macaque visual system?
- A discussion of how the new connectomic data can be used to constrain brain-computational models (i.e. models that simulate the information processing enabling the brain to perform an ecologically relevant task such as visual recognition, categorization, navigation, or reaching).
Minor points
The correlation between inter-area connection-weight matrices from diffusion imaging and cellular tracers is cited as 0.59, and cellular tracing is referred to as ground truth. However, tracing also provides merely summary statistical information and is affected by sample error. Have the reliabilities of diffusion-based and cellular-tracing-based inter-area connection-weight estimates been established? It would be good to consider these in interpreting the consistency between the two techniques.
Second, the weight of connection (if present) between two areas decays exponentially with their distance (the exponential distance rule) [17].
Here it would be great to elaborate on the concept of distance. I assume what is meant is the Euclidean distance in the folded cortex. Readers may wonder if the cortical geodesic distance or the tract length in the white matter are more relevant. Some readers may even think of the hierarchical distance. Good to clarify and address these different notions of distance.
