[R7I7]
Nastase et al. (pp2016) presented video clips (duration: 2 s) to 12 human subjects during fMRI. In a given run, a subject performed one of two tasks: detecting repetitions of either the animal’s behaviour (eating, fighting, running, swimming) or the category of animal (primate, ungulate, bird, reptile, insect). They performed region-of-interest and searchlight-based pattern analyses. Results suggest that:
- The animal behaviours are associated with clearly distinct patterns of activity in many regions, whereas different animal taxa are less discriminable overall. Within-animal-category representational dissimilarities (correlation distances) are similarly large as between-animal-category representational dissimilarities, indicating little clustering by these (very high-level) animal categories. However, animal-category decoding is above chance in a number of visual regions and generalises across behaviours, indicating some degree of linear separability. For the behaviours, there is strong evidence for both category clustering and linear separability (decodability generalising across animal taxa).
- Representations are remarkably stable across attentional tasks, but subtly modulated by attention in higher regions. There is some evidence for subtle attentional modulations, which (as expected) appear to enhance task-relevant sensory signals.
Overall, this is a beautifully designed experiment and the analyses are comprehensive and sophisticated. The interpretation in the paper focusses on the portion of the results that confirms the widely accepted idea that task-relevant signals are enhanced by attention. However, the stability of the representations across attentional tasks is substantial and deserves deeper analyses and interpretation.
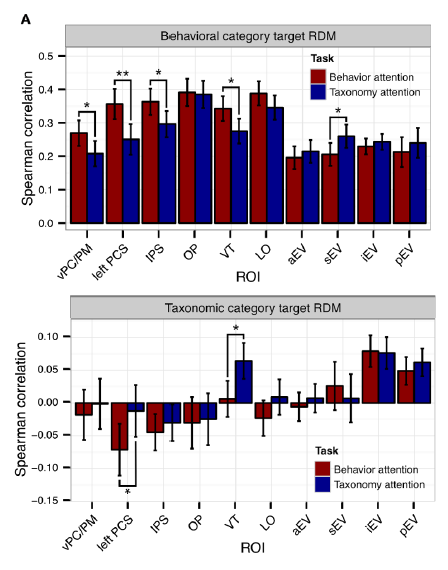
Spearman correlations between regional RDMs and behaviour-category RDM (top) and a animal-category RDM (bottom). These correlations measure category clustering in the representation. Note (1) that clustering is strong for behaviours but weak for animal taxa, and (2) that modulations of category clustering are subtly, but significant in several regions, notably in the left postcentral sulcus (PCS) and ventral temporal (VT) cortex.
Strengths
- The experiment is well motivated and well designed. The movie stimuli are naturalistic and likely to elicit vivid impressions and strong responses. The two attentional tasks are well chosen as both are quite natural. There are 80 stimuli in total: 5 taxa * 4 behaviours * 2 particular clips * 2 horizontally flipped versions. It’s impossible to control confounds perfectly with natural video clips, but this seems to strike quite a good balance between naturalism and richness of sampling and experimental control.
- The analyses are well motivated, sophisticated, well designed, systematic and comprehensive. Analyses include both a priori ROIs (providing greater power through fewer tests) and continuous whole-brain maps of searchlight information (giving rich information about the distribution of information across the brain). Surface-based searchlight hyperalignment based on a separate functional dataset ensures good coarse-scale alignment between subjects (although detailed voxel pattern alignment is not required for RSA). The cortical parcellation based on RDM clustering is also an interesting feature. The combination of threshold-free cluster enhancement and searchlight RSA is novel, as far as I know, and a good idea.
Weaknesses
- The current interpretation mainly confirms prevailing bias. The paper follows the widespread practice in cognitive neuroscience of looking to confirm expected effects. The abstract tells us what we already want to believe: that the representations are not purely stimulus driven, but modulated by attention and in a way that enhances the task-relevant distinctions. There is evidence for this in previous studies, for simple controlled stimuli, and in the present study, for more naturalistic stimuli. However, the stimulus, and not the task, explains the bulk of the variance. It would be good to engage the interesting wrinkles and novel information that this experiment could contribute, and to describe the overall stability and subtle task-flexibility in a balanced way.
- Behavioural effects confounded with species: Subjects saw a chimpanzee eating a fruit, but they never saw that chimpanzee, or in fact any chimpanzee fighting. The videos showed different animal species in the primate category. Effects of the animal’s behaviour, thus, are confounded with species effects. There is no pure comparison between behaviours within the same species and/or individual animal. It’s impossible to control for everything, but the interpretation requires consideration of this confound, which might help explain the pronounced distinctness of clips showing different behaviours.
- Asymmetry of specificity between behaviours and taxa: The behaviours were specific actions, which correspond to linguistically frequent action concepts (eating, fighting, running, swimming). However, the animal categories were very general (primate, ungulate, bird, reptile, insect), and within each animal category, there were different species (corresponding roughly to linguistically frequent basic-level noun concepts). The fact that the behavioural but not the animal categories corresponded to linguistically frequent concepts may help explain the lack of animal-category clustering.
- Representational distances were measured with the correlation distance, creating ambiguity. Correlation distances are ambiguous. If they increase (e.g. for one task as compared to another) this could mean (1) the patterns are more discriminable (the desired interpretation), (2) the overall regional response (signal) was weaker, or (3) the noise was greater; or any combination of these. To avoid this ambiguity, a crossvalidated pattern dissimilarity estimator could be used, such as the LD-t (Kriegeskorte et al. 2007; Nili et al. 2014) or the crossnobis estimator (Walther et al. 2015; Diedrichsen et al. pp2016; Kriegeskorte & Diedrichsen 2016). These estimators are also more sensitive (Walther et al. 2015) because, like the Fisher linear discriminant, they benefit from optimal weighting of the evidence distributed across voxels and from noise cancellation between voxels. Like decoding accuracies, these estimators are crossvalidated, and therefore unbiased (in particular, the expected value of the distance estimate is zero under the null hypothesis that the patterns for two conditions are drawn from the same distribution). Unlike decoding accuracies, these distance estimators are continuous and nonsaturating, providing a more sensitive and undistorted characterisation of the representational geometry.
- Some statistical analysis details are missing or unclear. The analyses are complicated and not everything is fully and clearly described. In several places the paper states that permutation tests were used. This is often a good choice, but not a sufficient description of the procedure. What was the null hypothesis? What entities are exchangeable under that null hypothesis? What was permuted? What exactly was the test statistic? The contrasts and inferential thresholds could be more clearly indicated in the figures. I did not understand in detail how searchlight RSA and threshold-free cluster enhancement were combined and how map-level inference was implemented. A more detailed description should be added.
- Spearman RDM correlation is not optimally interpretable. Spearman RDM correlation is used to compare the regional RDMs with categorical RDMs for either behavioural categories or animal taxa. Spearman correlation is not a good choice for model comparisons involving categorical models, because of the way it deals with ties, of which there are many in categorical model RDMs (Nili et al. 2014). This may not be an issue for comparing Spearman RDM correlations for a single category-model RDM between the two tasks. However, it is still a source of confusion. Since these model RDMs are binary, I suspect that Spearman and Pearson correlation are equivalent here. However, for either type of correlation coefficient, the resulting effect size depends on the proportion of large distances in the model matrix (30 of 190 for the taxonomy and 40 of 190 for the behavioural model). Although I think it is equivalent for the key statistical inferences here, analyses would be easier to understand and effect sizes more interpretable if differences between averages of dissimilarities were used.
Suggestions
In general, the paper is already at a high level, but the authors may consider making improvements addressing some of the weaknesses listed above in a revision. I have a few additional suggestions.
- Open data: This is a very rich data set that cannot be fully analysed in a single paper. The positive impact on the field would be greatest if the data were made publicly available.
- Structure and clarify the results section: The writing is good in general. However, the results section is a long list of complex analyses whose full motivation remains unclear in some places. Important details for basic interpretation of the results should be given before stating the results. It would be good to structure the results section according to clear claims. In each subsection, briefly state the hypothesis, how the analysis follows from the hypothesis, and what assumptions it depends on, before describing the results.
- Compare regional RDMs between tasks without models: It would be useful to assess whether representational geometries change across tasks without relying on categorical model RDMs. To this end the regional RDMs (20×20 stimuli) could be compared between tasks. A good index to be computed for each subject would be the between-task RDM correlation minus the within-task RDM correlation (both across runs and matched to equalise the between run temporal separation). Inference could use across subject nonparametric methods (subject as random effect). This analysis would reveal the degree of stability of the representational geometry across tasks.
- Linear decoding generalising across tasks: It would be good to train linear decoders for behaviours and taxa in one task and test for generalisation to the other task (and simultaneously across the other factor).
- Independent definition of ROIs: Might the functionally driven parcellation of the cortex and ROI selection based on intersubject searchlight RDM reliability not bias the ROI analyses? It seems safer to use independently defined ROIs.
- Task decoding: It would be interesting to see a searchlight maps of task decodability. Training and test sets should always consist of different runs. One could assess generalisation to new runs and ideally also generalisation across behaviours and taxa (leaving out one animal category or one behavioural category from the training set).
- Further investigate the more prominent distinctions among behaviours than among taxa: Is this explained by a visual similarity confound? Cross-decoding of behaviour between taxa sheds some light on this. However, it would be good also to analyse the videos with motion-energy models and look at the representational geometries in such models.
Additional specific comments and questions
Enhancement and collapse have not been independently measured. The abstract states: “Attending to animal taxonomy while viewing the same stimuli increased the discriminability of distributed animal category representations in ventral temporal cortex and collapsed behavioural information.” Similarly, on page 12, it says: “… accentuating task-relevant distinctions and reducing unattended distinctions.”
This description is intuitive, but it incorrectly suggests that the enhancement and collapse have been independently measured. This is not the case: It would require a third, e.g. passive-viewing condition. Results are equally consistent with the interpretation that attention just enhances the task-relevant distinctions (without collapsing anything). Conversely, the reverse might also be consistent with the results shown: that attention just collapses the task-irrelevant distinctions (without enhancing anything).
You explain in the results that this motivates the use of the term categoricity, but then don’t use that term consistently. Instead you describe it as separate effects, e.g. in the abstract.
The term categoricity may be problematic for other reasons. A better description might be “relative enhancement of task-relevant representational distinctions”. Results would be more interpretable if crossvalidated distances were used, because this would enable assessment of changes in discriminability. By contrast, larger correlation distance can also result from reduced responses or nosier data.
Map-inferential thresholds are not discernable: In Fig. 2, all locations with positively model-correlated RDMs are marked in red. The locations exceeding the map-inferential threshold are not visible because the colour scale uses red for below- and above-threshold values. The legend (not just the methods section) should also clarify whether multiple testing was corrected for and if so how. The Fig. 2 title “Effect of attention on local representation of behaviour and taxonomy” is not really appropriate, since the inferential results on that effect are in Fig. S3. Fig. S3 might deserve to be in the main paper, given that the title claim is about task effects.
Videos on YouTube: To interpret these results, one really has to watch the 20 movies. How about putting them on YouTube?
Previous work: The work of Peelen and Kastner and of Sigala and Logothetis on attentional dependence of visual representations should be cited and discussed.
Colour scale: The jet colour scale is not optimal in general and particularly confusing for the model RDMs. The category model RDMs for behaviour and taxa seem to contain zeroes along the diagonal, ones for within-category comparisons and twos for between-category comparisons. Is the diagonal excluded from model? In that case the matrix is binary, but contains ones and twos instead of zeroes and ones. While this doesn’t matter for the correlations, it is a source of confusion for readers.
Show RDMs: To make results easier to understand, why not show RDMs? Could average certain sets of values for clarity.
Statistical details
“When considering all surviving searchlights for both attention tasks, the mean regression coefficient for the behavioural category target RDM increased significantly from 0.100 to 0.129 (p = .007, permutation test).”
Unclear: What procedure do these searchlights “survive”? Also: what is the null hypothesis? What is permuted? Are these subject RFX tests?
The linear mixed effects model of Spearman RDM correlations suggests differences between regions. However, given the different noise levels between regions, I’m not sure these results are conclusive (cf. Diedrichsen et al. 2011).
“To visualize attentional changes in representational geometry, we first computed 40 × 40 neural RDMs based on the 20 conditions for both attention tasks and averaged these across participants.”
Why is the 40×40 RDM (including, I understand, both tasks) ever considered? The between-task pattern comparisons are hard to interpret because they were measured in different runs (Henriksson et al. 2015; Alink et al. pp2015).
“Permutation tests revealed that attending to animal behaviour increased correlations between the observed neural RDM and the behavioural category target RDM in vPC/PM (p = .026), left PCS (p = .005), IPS (p = .011), and VT (p = .020).”
What was the null? What was permuted? Do these survive multiple testing correction? How many regions were analysed?
Fig. 3: Bootstrapped 95% confidence intervals. What was bootstrapped? Conditions?
page 14: Mean of searchlight regression coefficients – why only select those searchlights that survive TFCE in both attention conditions?
page 15: Parcellation of ROIs based on the behaviour attention data only. Why?
SI text: Might eye movements constitute a confound? (Free viewing during video clips)
“more unconfounded” -> “less confounded”
Acknowledgement
Thanks to Marieke Mur for discussing this paper with me and sharing her comments, which are included above.
— Nikolaus Kriegeskorte
