[I6 R8]
The orientation of a visual grating can be decoded from fMRI response patterns in primary visual cortex (Kamitani & Tong 2005, Haynes & Rees 2005). This was surprising because fMRI voxels in these studies are 3 mm wide in each dimension and thus average over many columns of neurons that respond to different orientations. Since then, many studies have sought to clarify why fMRI orientation decoding works so well.
The first explanation given was that even though much of the contrast of the neuronal orientation signals might cancel out in the averaging within each voxel, any given voxel might retain a slight bias toward certain orientations if it didn’t sample all the columns exactly equally (Kamitani & Tong 2005, Boynton 2005). By integrating the evidence across many slightly biased voxels with a linear decoder, it should then be possible to guess, better than chance, the orientation of the stimulus.
Later work explored how random orientation biases might arise in the voxels. If each voxel directly sampled the orientation columns (computing an average within its cuboid boundaries), then decoding success should be very sensitively dependent on the alignment of the voxels between training and test sets. A shift of the voxel grid on the scale of the width of an orientation column would change the voxel biases and abolish decoding success. Several groups have argued that the biases might arise at the level of the vasculature (Gardner et al. 2009, Kriegeskorte et al. 2009). This would make the biases enabling orientation decoding less sensitive to slight shifts of the voxel grid. Moreover, if voxels reflected signals sampled through the fine-grained vasculature, then it would be the vasculature, not the voxel grid that determines to what extent different spatial frequencies of the underlying neuronal activity patterns are reflected in the fMRI patterns (Kriegeskorte et al. 2009).
Another account (Op de Beeck 2010, Freeman et al. 2011) proposed that decoding may rely exclusively on coarse-scale spatial patterns of activity. In particular, Freeman , and argued that radial orientations (those aligned with a line that passes through the point of fixation) are over-represented in the neural population. If this were the case, then a grating would elicit a coarse-scale response pattern across its representation in V1, in which the neurons representing edges pointing (approximately) at fixation are more strongly active. There is indeed evidence from multiple studies for a nonuniform representation of orientations in V1 (Furmanski & Engel 2000, Sasaki et al., 2006, Serences et al. 2009, Mannion et al. 2010), perhaps reflecting the nonuniform probability distribution of orientation in natural visual experience. The over-representation of radial orientations might help explain the decodability of gratings. However, opposite-sense spirals (whose orientations are balanced about the radial orientation) are also decodable (Mannion et al. 2009, Alink et al. 2013). This might be due to a simultaneous over-representation of vertical orientations (Freeman et al. 2013, but see Alink et al. 2013).
There’s evidence in favor of a contribution to orientation decoding of both coarse-scale (Op de Beeck 2010, Freeman et al. 2011, Freeman et al. 2013) and fine-scale components of the fMRI patterns (e.g. Shmuel et al. 2010, Swisher et al. 2010, Alink et al. 2013, Pratte et al. 2016, Alink et al. 2017).
Note that both coarse-scale and fine-scale pattern accounts suggest that voxels have biases in favor of certain orientations. A entirely novel line of argument was introduced to the debate by Carlson (2014).
Carlson (2014) argued, on the basis of simulation results, that even if every voxel sampled a set of filters uniformly representing all orientations (i.e. without any bias), the resulting fMRI patterns could still reflect the orientation of a grating confined to a circular annulus (as standardly used in the literature). The reason lies in “the interaction between the stimulus region and the empty background” (Carlson 2014), an effect of the relative orientations of the grating and the edge of the aperture (the annulus within which the grating is visible). Carlson’s simulations showed that the average response of a uniform set of Gabor orientation filters is larger where the aperture edge is orthogonal to the grating. He also showed that the effect does not depend on whether the aperture edge is hard or soft (fading contrast). Because the voxels in this account have no biases in favor of particular orientations, Carlson aptly referred to his account as an “unbiased” perspective.
The aperture edge adds edge energy. The effect is strongest when the edge is orthogonal to the carrier grating orientation. We can understand this in terms of the Fourier spectrum. Whereas a sine grating has a concentrated representation in the 2D Fourier amplitude spectrum, the energy is more spread out when an aperture limits the extent of the grating, with the effect depending on the relative orientations of grating and edge.
For an intuition on how this kind of thing can happen, consider a particularly simple scenario, where a coarse rectangular grating is limited by a sharp aperture whose edge is orthogonal to the grating. V1 cells with small receptive fields will respond to the edge itself as well as to the grating. When edge and grating are orthogonal, the widest range of orientation-selective V1 cells is driven. However, the effect is present also for sinusoidal gratings and soft apertures, where contrast fades gradually, e.g. according to a raised half-cosine.
An elegant new study by Roth, Heeger, and Merriam (pp2018) now follows up on the idea of Carlson (2014) with fMRI at 3T and 7T. Roth et al. refer to the interaction between the edge and the content of the aperture as “vignetting” and used apertures composed of either multiple annuli or multiple radial rays. These finer-grained apertures spread the vignetting effect all throughout the stimulated portion of the visual field and so are well suited to demonstrate the effect on fMRI patterns.
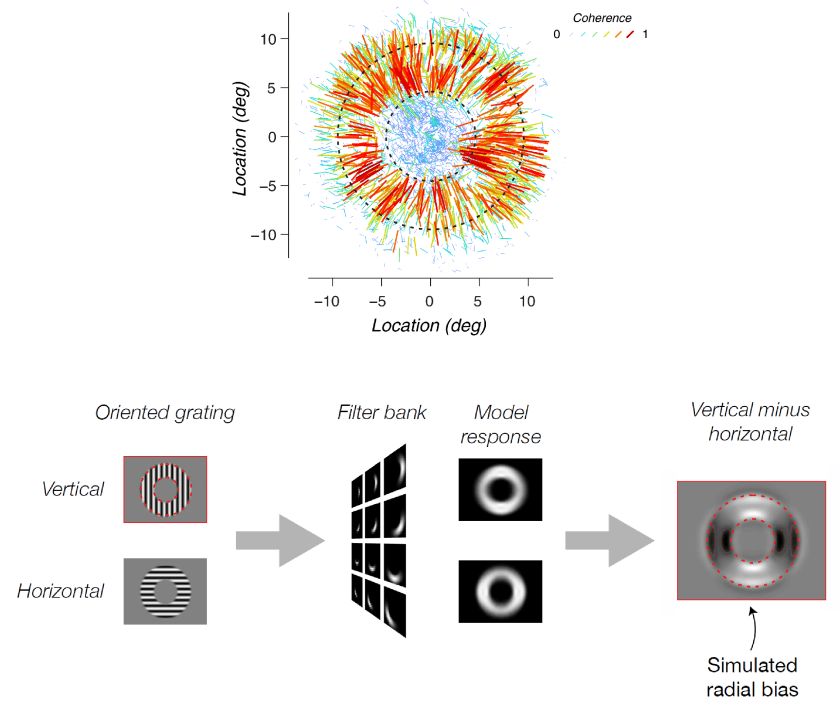
Roth et al. present simulations (Figure 1), following Carlson (2014) and assuming that every voxel uniformly samples all orientations. They confirm Carlson’s account and show that the grating stimuli the group used earlier in Freeman et al. (2011) are expected to produce the stronger response to radial parts of the grating, where the aperture edge is orthogonal to the grating — even without any over-representation of radial orientations by the neurons.
Freeman et al. (2011) used a relatively narrow annulus (inner edge: 4.5º, outer edge: 9.5º eccentricity from fixation), where no part of the grating is far from the edge. This causes the vignetting effect to create the appearance of a radial bias that is strongest at the edges but present even in the central part of the annular aperture (Figure 1, bottom right). Roth et al.’s findings suggest that the group’s earlier result might reflect vignetting, rather than (or in addition to) a radial bias of the V1 neurons.
Roth et al. use simulations also to show that their new stimuli, in which the aperture consists of multiple annuli or multiple radial rays, predict coarse-scale patterns across V1. They then demonstrate in single subjects measured with fMRI at 3T and 7T that V1 responds with the globally modulated patterns predicted by the account of Carlson (2014).
The study is beautifully designed and expertly executed. Results compellingly demonstrate that, as proposed by Carlson (2014), vignetting can account for the coarse-scale biases reported in Freeman et al. (2011). The paper also contains a careful discussion that places the phenomenon in a broader context. Vignetting describes a family of effects related to aperture edges and their interaction with the contents of the aperture. The interaction could be as simple as the aperture edge adding edge energy of a different orientation and thus changing orientation-selective response. It could also involve extra-receptive-field effects such as non-isotropic surround suppression.
The study leaves me with two questions:
- Is the radial orientation-preference map in V1, as described in Freeman et al. (2011), entirely an artefact of vignetting (or is there still also an over-representation of radial orientations in the neuronal population)?
- Does vignetting also explain fMRI orientation signals in studies that use larger oriented gratings, where much of the grating is further from the edge of the aperture, as in Kamitani & Tong (2005)?
The original study by Kamitani and Tong (2005) used a wider annular aperture reaching further into the central region, where receptive fields are smaller (inner edge: 1.5°, outer edge: 10° eccentricity from fixation). The interior parts of the stimulus may therefore not be affected by vignetting. Importantly, Wardle, Ritchie, Seymour, and Carlson (2017) already investigated this issue and their results suggest that vignetting is not necessary for orientation decoding.
It would be useful to analyze the stimuli used by Kamitani & Tong (2005) with a Gabor model (with reasonable choices for the filter sizes). As a second step, it would be good to reanalyze the data from Kamitani & Tong (2005), or from a similar design. The analysis should focus on small contiguous ROIs in V1 of the left and right hemisphere that represent regions of the visual field far from the edge of the aperture.
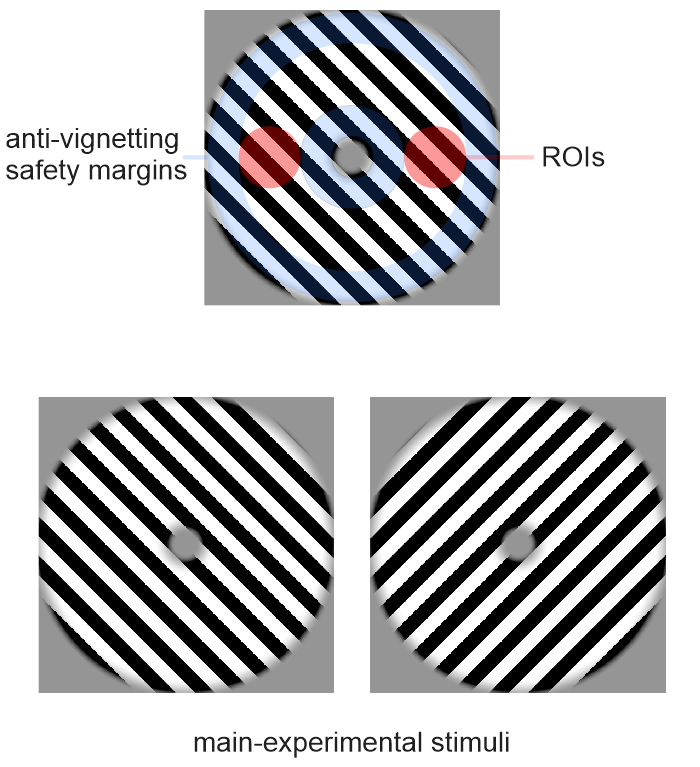
Going forward, perhaps we can pursue the issue in the spirit of open science. We would acquire fMRI data with maximally large gratings, so that regions unaffected by vignetting can be analyzed (Figure 2). The experiments should include localizers for the aperture margins (transparent blue) and for ROIs perched on the horizontal meridian far from the aperture edges (transparent red). The minimal experiment would contain two grating orientations (45º and -45º as shown at the bottom), each presented with many different phases. Note that, for the ROIs shown in Figure 2, these two orientations mimimize undesired voxel biases due to radial and vertical orientation preferences (both gratings have equal angle to the radial orientation and equal angle to the vertical orientation). Note also that these two orientations have equal angle to the aperture edge, thus also minimizing any residual long-range vignetting effect that acts across the safety margin.
The analysis of the ROIs should follow Alink et al. (2017): In each ROI (left hemisphere, right hemisphere), we use a training set of fMRI runs to define two sets of voxels: 45º-preferring and -45º-preferring voxels. We then use the test set of fMRI runs to check, independently for the two voxel sets, whether the preferences replicate. We could implement a sensitive test along these lines by training and testing a linear decoder on just the 45º-preferring voxels, and then another linear decoder on just the -45º-preferring voxels. If both of these decoders have significant accuracy on the test set, we have established that voxels of opposite selectivity intermingle within the same small ROI, indicating fine-grained pattern information.
A more comprehensive experiment would contain perhaps 8 or 16 equally spaced orientations and a range of spatial frequencies balanced about the spatial frequency that maximally drives neurons at the eccentricity of the critical ROIs (Henriksson et al. 2008).
More generally, a standardized experiment along these lines would constitute an excellent benchmark for comparing fMRI acquisition schemes in terms of the information they yield about neuronal response patterns. Such a benchmark would lend itself to comparing different spatial resolutions (0.5 mm, 1 mm, 2 mm, 3 mm), different fMRI sequences, and different field strengths (3T, 7T) across different sites and scanner models. The tradeoffs involved (notably between functional contrast to noise and partial volume sampling) are difficult to estimate without directly testing each fMRI acquisition scheme for the information it yields (Formisano & Kriegeskorte 2012). A standard pattern-information benchmark for fMRI could therefore be really useful, especially if pursued as an open-science project (shared stimuli and presentation protocol, shared fMRI data, contributor coauthorships on the first three papers using someone’s openly shared components).
Glad we sorted this out. Who’s up for collaborating?
Time to go to bed.
Strengths
- Well-motivated and elegant experimental design and analysis
- 3T and 7T fMRI data from a total of 14 subjects
- Compelling results demonstrating that vignetting can cause coarse-scale patterns that enable orientation decoding
Weaknesses
- The paper claims to introduce a novel idea that requires reinterpretation of a large literature. The claim of novelty is unjustified. Vignetting was discovered by Carlson et al. (2014) and in Wardle et al. (2017), Carlson’s group showed that it may be one, but not the only contributing factor enabling orientation decoding. Carlson et al. deserve clearer credit throughout.
- The experiments show that vignetting compromised the stimuli of Freeman et al. (2011), but they don’t address whether the claim by Freeman et al. of an over-representation of radial orientations in the neuronal population holds regardless.
- The paper doesn’t attempt to address whether decoding is still possible in the absence of vignetting effects, i.e. far from the aperture boundary.
Particular comments and suggestions
While the experiments and analyses are excellent and the paper well written, the current version is compromised by some exaggerated claims, suggesting greater novelty and consequence than is appropriate. This should be corrected.
“Here, we show that a large body of research that purported to measure orientation tuning may have in fact been inadvertently measuring sensitivity to second-order changes in luminance, a phenomenon we term ‘vignetting’.” (Abstract)
“Our results demonstrate that stimulus vignetting can wholly determine the orientation selectivity of responses in visual cortex measured at a macroscopic scale, and suggest a reinterpretation of a well-established literature on orientation processing in visual cortex.” (Abstract)
“Our results provide a framework for reinterpreting a wide-range
of findings in the visual system.” (Introduction)
Too strong of a claim of novelty. The effect beautifully termed “vignetting” here was discovered by Carlson (2014), and that study deserves the credit for triggering a reevaluation of the literature, which began four years ago. The present study does place vignetting in a broader context, discussing a variety of mechanisms by which aperture edges might influence responses, but the basic idea, including that the key factor is the interaction between the edge and the grating orientation and that the edge need not be hard, are all introduced in Carlson (2014). The present study very elegantly demonstrates the phenomenon with fMRI, but the effect has also previously been studied with fMRI by Wardle et al. (2017), so the fMRI component doesn’t justify this claim, either. Finally, while results compellingly show that vignetting was a strong contributor in Freeman et al. (2011), they don’t show that it is the only contributing factor for orientation decoding. In particular, Wardle et al. (2017) suggests that vignetting in fact is not necessary for orientation decoding.
“We and others, using fMRI, discovered a coarse-scale orientation bias in human V1; each voxel exhibits an orientation preference that depends on the region of space that it represents (Furmanski and Engel, 2000; Sasaki et al., 2006; Mannion et al., 2010; Freeman et al., 2011; Freeman et al., 2013; Larsson et al., 2017). We observed a radial bias in the peripheral representation of V1: voxels that responded to peripheral locations near the vertical meridian tended to respond most strongly to vertical orientations; voxels along the peripheral horizontal meridian responded most strongly to horizontal orientations; likewise for oblique orientations. This phenomenon had gone mostly unnoticed previously. We discovered this striking phenomenon with fMRI because fMRI covers the entire retinotopic map in visual cortex, making it an ideal method for characterizing such coarse-scale representations.” (Introduction)
A bit too much chest thumping. The radial-bias phenomenon was discovered by Sasaki et al. (2006). Moreover, the present study negates the interpretation in Freeman et al. (2011). Freeman et al. (2011) interpreted their results as indicating an over-representation of radial orientations in cortical neurons. According to the present study, the results were in fact an artifact of vignetting and whether neuronal biases played any role is questionable. Freeman et al. used a narrower annulus than other studies (e.g. Kamitani & Tong, 2005), so may have been more susceptible to the vignetting artifact. The authors suggest that a large literature be reinterpreted, but apparently not their own study for which they specifically and compellingly show how vignetting probably affected it.
“A leading conjecture is that the orientation preferences in fMRI measurements arise primarily from random spatial irregularities in the fine-scale columnar architecture (Boynton, 2005; Haynes and Rees, 2005; Kamitani and Tong, 2005). […] On the other hand, we have argued that the coarse-scale orientation bias is the predominant orientation-selective signal measured with fMRI, and that multivariate decoding analysis methods are successful because of it (Freeman et al., 2011; Freeman et al., 2013). This conjecture remains controversial because the notion that fMRI is sensitive to fine-scale neural activity is highly attractive, even though it has been proven difficult to validate empirically (Alink et al., 2013; Pratte et al., 2016; Alink et al., 2017).” (Introduction)
This passage is a bit biased. First, the present results question the interpretation of Freeman et al. (2011). While the authors’ new interpretation (following Carlson, 2014) also suggests a coarse-scale contribution, it fundamentally changes the account. Moreover, the conjecture that coarse-scale effects play a role is not controversial. What is controversial is the claim that only coarse-scale effects contribute to fMRI orientation decoding. This extreme view is controversial not because it is attractive to think that fMRI can exploit fine-grained pattern information, but because the cited studies (Alink et al. 2013, Pratte et al. 2016, Alink et al. 2017, and additional studies, including Shmuel et al. 2010 and Swisher et al. 2010) present evidence in favor of a contribution from fine-grained patterns. The way the three studies are cited would suggest to an uninformed reader that they provide evidence against a contribution from fine-grained patterns. More evenhanded language is in order here.
“the model we use is highly simplified; for example, it does not take into account changes in spatial frequency tuning at greater eccentricities. Yet, despite the multiple sources of noise and the simplified assumptions of the model, the correspondence between the model’s prediction and the empirical measurements are highly statistically significant. From this, we conclude that stimulus vignetting is a primary source of the course[sic] scale bias.”
This argument is not compelling. A terrible model may explain a portion of the explainable variance that is minuscule, yet highly statistically significant. In the absence of inferential comparisons among multiple models and model checking (or a noise ceiling), better to avoid such claims.
“One study (Alink et al., 2017) used inner and outer circular annuli, but added additional angular edges, the result of which should be a combination of radial and tangential biases. Indeed, this study reported that voxels had a mixed pattern of selectivity, with a considerable number of voxels reliably preferring tangential gratings, and other voxels reliably favoring radial orientations.” (Discussion)
It’s true that the additional edges between the patches (though subtle) complicate the interpretation of the results of Alink et al. (2017). It would be good to check the strength of the effect by simulation. Happy to share the stimuli if someone wanted to look into this.
Minor points
Figure 4A, legend: Top and bottom panels mislabeled as showing angular and radial modulator results, respectively.
course -> coarse
complimentary -> complementary
