[R6I7]
Seibert, Yamins, Ardila, Hong, DiCarlo, and Gardner compared a deep convolutional neural network for visual object recognition to human ventral-stream representations as measured with fMRI (PP). The network was similar to the one described in Krizhevsky et al. (2012), the network that won the ImageNet competition that year with a large increase in performance compared to previous computer vision systems. The representations in the layers of the Krizhevsky deep net and similar models have been compared to human and monkey brain representations at different stages of the ventral stream previously (Yamins et al. 2013, Yamins et al. 2014; Khaligh-Razavi & Kriegeskorte 2014; Cadieu et al. 2014; Güçlü & van Gerven 2015). The present study is consistent with the previous results, generalises this line work to an interesting new set of test images, and investigates how the representational similarity of the model layers to the brain areas evolves as model performance is optimised. Results suggest that the optimisation of recognition performance increases representational similarity to visual areas, even for early and mid-level visual areas.
Model architecture: The convolutional network was inspired by that of Krizhevsky et al. (2012), using similar convolutional filter sizes, rectified linear units, the same pooling and local normalisation procedures, and data from ImageNet for training on 1000-class categorisation. However, the input images were downsampled to a substantially smaller size (120 x 120 pixels, instead of 224 x 224 pixels). Another major modification was that two intermediate fully connected layers (which contain most of the parameters in Krizhevsky et al.’s net) were omitted. This is reported to have no significant effect on recognition performance on an independent ImageNet test set.
Training and test stimuli: Like Krizhevsky et al., Seibert et al. trained the network by backpropagation to classify objects into 1000 categories. They used the very large ImageNet set of labelled images for model training and then presented the network and two human subjects with a different set of more controlled images: 1,785 grayscale images of 3D renderings of objects in many positions and views, superimposed to random natural backgrounds.
Representational similarity analysis: The authors compared the representational dissimilarity matrices (RDMs) between model layers and brain areas. They first randomly selected 1000 model features from a given layer, then reweighted these features, stretching and squeezing the representational space along its original axes, so as to maximise the RDM correlation between the model layer and the brain region. The maximisation of the RDM correlation was performed on the basis of 15 of the images for each of the 64 objects (different positions, views, and backgrounds). Using the fitted weights, they then re-estimated the model RDMs on the basis of the other 12 position-view combinations for the same 64 objects and computed the RDM correlation (Spearman) between model layer and brain region.
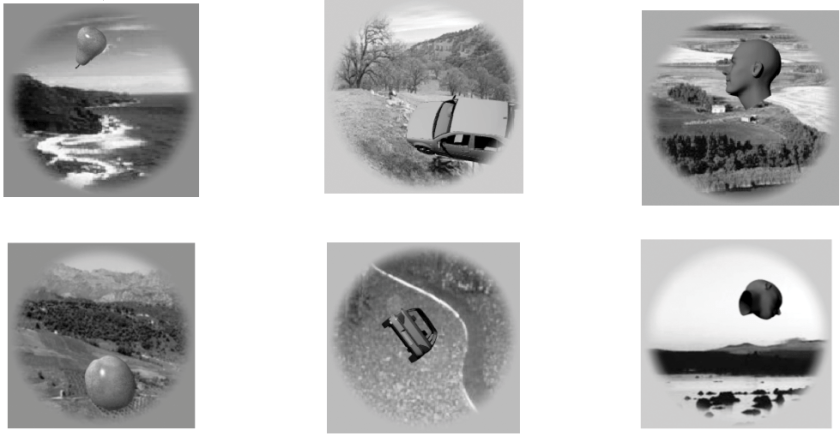
Detail of Figure 1 from the paper: Grayscale stimulus images were created by superimposing 3D models to natural backgrounds. The set strikes an interesting balance between naturalness and control. There were 8 objects from each of 8 categories (animals, boats, cars, chairs, faces, fruits, planes, tables) and each object was presented in 27 or 28 different combinations of position (including entirely nonoverlapping positions), view, and natural background image. For each of the 8 x 8 = 64 objects, they averaged response patterns to all the images that contained it, so as to compute 64 x 64-entry representational dissimilarity matrices (RDMs) using 1-Pearson correlation as the distance measure.
Related previous work: This work is closely related to recent papers by Yamins et al. (2013; 2014), Khaligh-Razavi et al. (2014), Cadieu et al. (2014), and Güçlü & van Gerven (2015). Yamins et al. showed that performance-optimised convolutional network models explain primate-IT neuronal recordings, with models performing better at object recognition also better explaining IT. Khaligh-Razavi et al. compared 37 computational model representations, including the layers of the Krizhevsky et al. (2012) model and a range of popular computer vision features, to human fMRI and monkey recording data (Kiani et al. 2007) and found that only the deep convolutional net, which was extensively trained to emphasize categorical divisions, could fully explain the IT data. They also showed that early visual cortex is well accounted for by earlier layers of the deep convolutional network (and by Gabor representations and other computer vision features). Cadieu et al. (2014) showed that among 6 different models, only Krizhevsky et al. (2012) and an even more powerful deep convolutional network by Zeiler & Fergus (2013) separate the categories in the representational space to a degree comparable to IT cortex. Güçlü & van Gerven (2015) investigated to what extent each layer of the model could explain the representations in each visual area of the ventral stream, finding rough correspondences between lower, intermediate, and higher model representations and early, mid-level, and higher ventral-stream regions, respectively.
How does the present work go beyond previous studies? The most striking novel contribution of this study is the characterisation of how representational similarity to visual areas develops as the neural net’s performance is optimised from a random initialisation. Unlike Yamins et al. (2014) and Cadieu et al. (2014), this study compares a convolutional network to the human ventral stream and, unlike Khaligh-Razavi & Kriegeskorte (2014), each image was presented in many positions and views and with many different backgrounds. The data is from only two subjects, but each subject underwent 9 sessions, so the total data set is substantial. The human fMRI data set is exciting in that it systematically varies category, exemplar, and accidental properties (position, view, background). However, the authors averaged across different images of each of the objects. I wonder if this data set has further potential for future analyses that don’t average across responses to different images.
Comparing many model representations to each of the areas of the visual system is a challenge requiring multiple studies. It’s great to see another study comparing the layers (including pooling layers and intermediate convolutional stages) alongside several control models (V1-like, V2-like, HMAX), which hadn’t been compared to deep convolutional networks before.
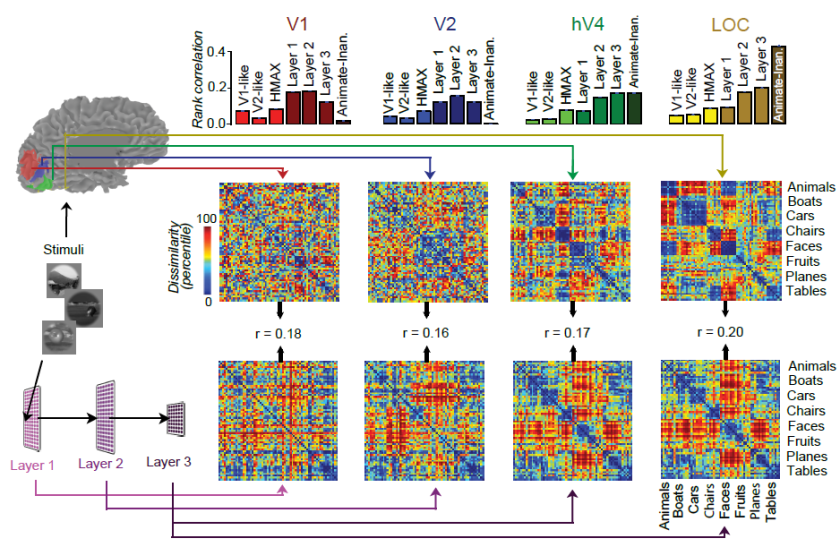
Figure 2 from the paper: Successive stages of the human ventral stream (V1, V2, V4, LOC) are best explained by successive layers of a deep convolutional neural net model. The representational geometry in V1 most resembles that of a lower and an intermediate layer of the network. The representational geometry in V2 most resembles that of an intermediate layer. And the representational geometries of V4 and LOC most resemble that of a higher layer of the network. Categories are reflected in clusters of response patterns in V4 and even more strongly in LOC. The same holds for higher layers of the network model.
Strengths
- Model predictions of brain representational geometries are analysed as a function of model performance. This nicely demonstrates that it is not just the architecture, but performance optimisation that drives successful predictions of representations across all levels of the ventral stream.
- Adds to the evidence that deep convolutional neural networks can explain the feedforward component of the stagewise representational transformations in the ventral visual stream.
- Rich stimulus set of 1785 images that strikes an interesting balance between naturalism and control, independently varying objects and accidental properties.
- Multiple data sets in each subject. This fMRI data set could in the future support tests of a wide variety of models.
Weaknesses
- Statistical procedures are not clearly described and not fully justified. What type of generalisation does the crossvalidation scheme test for? What is being bootstrapped? Why are normal and independence assumptions relied on for inference, when bootstrapping the objects would enable straightforward tests that don’t require these assumptions?
- The analysis is based on average response patterns across many different images for each object. This renders results more difficult to interpret.
- Only two subjects.
Overall, this is a very nice study and a substantial contribution to the literature. However, the averaging across responses elicited by different images complicates the interpretation of the results and the statistical analyses need to be improved, better described, and fully justified – as detailed below. Although the overall results described in this review appear likely to hold up, I am not confident that the inferential results for particular model comparisons are reliable. (If concerns detailed below were substantively addressed, I would consider adjusting the reliability rating.)
Issues to consider addressing in a revision
(1) Can averaged response patterns elicited by different individual images be interpreted?
If we knew a priori that a region represents the objects with perfect invariance to position, view and background, then averaging across many images of the same objects that differ in these variables would make sense. However, we know that none of the regions is really invariant to position, view, and background, and gradually achieving some tolerance is one of the central computational challenges. The averaging will have differential effects in different regions as tolerance increases along the ventral stream. I don’t understand how to interpret the RDM for V1 given that it is based on averaged patterns. The object positions and backgrounds vary widely. Presumably different images of the same object are represented totally differently in V1. The averages should then form a tighter cluster of patterns (by factor 4 after averaging 16 images). Isn’t it puzzling then that the resulting RDM is still significantly correlated with the model? To explain this, do we have to assume that V1 actually represents the objects somewhat tolerantly (perhaps through feedback)? In a high-level representation tolerant to variation of accidental properties and sensitive to categorical differences, we expect the representations of the different images for a given object to be much more similar, so the averaging would have a smaller effect. All this confusion could be avoided by analysing patterns evoked by individual images. In addition, the emergence of tolerance across stages of processing could then be characterised.
(2) What type of generalisation does the crossvalidation scheme support?
Ideally, the crossvalidation should estimate the generalisation performance of the RDM prediction from the model for new images showing different objects. This is not the case here.
- First, it appears that the brain data used for training (model weight fitting) and test (estimation of RDM correlation) are responses to the same set of images (all images). The weighting of the model features is estimated using a subset of 15 of the images for each object, and the RDM correlation between model and brain data assessed using 12 different images (different poses and backgrounds) of the same objects. This would seem to fall short of a test of generalisation to new images (even of the same objects) because all images are used (on the side of the brain responses) in the training procedure. Please clarify this issue.
- Second, even if there was no overlap in the images used in training and test (on the side of either the model fitting or the brain data), the models are overfitted to the object set. Ideally, nonoverlapping sets of images of different objects should be used for training and testing. How about using a random subset of 4 of the objects in each category (32 in total) for fitting the weights and the other 32 objects for estimating the RDM correlation?
Overall, it seems unclear what type of generalisation these analyses test for. Let’s consider the issue of overfitting to the object set more closely. Currently, the weights w are fitted to 15 of the 27 images for a given object. In an idealised high-level representation invariant to the accidental variation, the two image sets will be identically represented. We expect the object representations to be in general position (no two on a point, no three on a line, no four on a plane and so on). Even if the 64 object representations were not at all clustered by category, but instead distributed randomly, we could linearly read out any categorical distinction and the decoder would generalise to the other 12 images. This is just to illustrate the expected effect of overfitting to the object set. In the present study, weights were fitted to predict RDMs not to discriminate categories. Fitting the 1000 scaling parameters to explain an RDM with 64*(64-1)/2 = about 2K dissimilarities should enable us to fit any RDM quite precisely. I would not be surprised if a noncategorical representation could fit a clearly categorical representation (block-diagonal RDM) in this context. The test-set correlations would then really just be a measure of the replicability of the brain RDMs – rather than a measure of the fit of the model. Regularisation might help ensure that different models are still distinguishable, but it also further complicates interpretation (see below).
Since higher regions are more tolerant, the training and test images are more similarly represented in these regions, and so we would expect greater positive overfitting bias on the estimated RDM correlation for higher regions regardless of the model. It is reassuring that the models still perform differently in LOC. However, the overfitting to the object set complicates interpretation.
The category decoding performance measure is similarly compromised by averaging across different images. Decoding performance as well (if I understood correctly) was tested by averaging different images for each object and training and testing on the same set of objects with different particular images in the test set. So the test is not a test of generalisation to different objects but to different images of the same objects. Again any representation uniquely representing each object (and having at least as many dimensions as the number of objects in both classes combined minus one, which is the case here) will appear to support linear category decoding, even if the distributions in representational space corresponding to the two categories (including the entire populations of objects they comprise) were not at all linearly separable and across-object generalisation performance were at chance level.
(3) Clarify the bootstrapping procedure used in model comparison
The first 6 times the term bootstrap is used, it is entirely unclear what entities are being resampled with replacement. The sampling of 1000 model units is explained in this context, and suggests that this is the resampling with replacement referred to as bootstrapping. Only on page 15 it says: “Our approach bootstraps over independent stimulus samples”. I’m not sure what multiple independent stimulus samples are meant here. Are the objects (averaged across images) resampled? Or are the images resampled? (The latter would necessitate re-estimating the object-average voxel responses to each object for each bootstrap sample.)
(4) Clarify and justify the test used for model comparison
The methods section states:
“Using the bootstrapping above, we computed p-values testing if Layer A better explained visual area X’s RDM than Layer B”
This suggests that a bootstrap test was used to compare models with respect to their RDM prediction performance. But then the model comparison test is described as follows:
“We use Fisher’s r-to-z transformation using Steiger (1980)’s approach to compute p-values for difference in correlation values (Lee and Preacher, 2013). The approach tests for equality of two correlation values from the same sample where one variable is held in common between the two coefficients (in our case, an RDM of a given visual area).”
The Steiger (1980) method for comparing two dependent correlations assumes that the elements of the correlated vectors are sampled independently. As you acknowledge, this is violated for dissimilarities in an RDM. But why then is the Steiger method appropriate? You mention bootstrapping, but don’t explain how your bootstrapping procedure interacts with the Steiger method. Kriegeskorte et al. (2008) and Nili et al. (2014) describe a bootstrapping approach to RDM model comparison that takes the dependencies between dissimilarities into account and does not rely on the Steiger method. Ideally, the objects, not the images, should be resampled with replacement, to simulate variation across objects (not across images of the same objects) and to avoid re-estimation of object-average patterns. Finally, it would be good to use model-comparative inference to support the improvement the RDM explanation of ventral stream regions as performance is optimised by training with backpropagation.
(5) Reconsider the regularisation used in feature-weight fitting
The one-iteration optimisation (motivated as a variant of early stopping) is a very ad-hoc choice of regulariser. I have no idea what prior is implicit to this method. However, this implicit prior is part of the model you are testing and affects the model comparison results. It is even a key component of the model because you are fitting so many parameters that different models might not be distinguishable without this prior.
(6) Show full inferential results with correction for multiple testing
It would be great if the figures showed which RDM correlations are significant and which pairs are significantly different. In addition, it would be good to account for multiple testing. Nonparametric methods for testing and comparing RDM correlations are described in Nili et al. (2014).
(7) Show noise ceilings
It would be good to see whether the model layers fully or only partially explain the explainable component of the variance in the RDMs. This could yield the insight that the model does fall short given the present study’s data set. It would be interesting then to learn how it falls short and this would motivate future changes to the model. Alternatively, if the model reaches the noise ceiling, we would learn that we need to get better or more data to find out how the model still falls short. The methods section suggests that a noise ceiling was estimated for Figure 6, stating:
“To avoid the problem of finding linear re-weightings using smaller sub-sets of our data, we instead computed noise ceilings and percent explained variance values (Figure 6) without using the weighting procedure described above. Noise ceilings for each visual area were computed by splitting the runs of our data into two non-overlapping groups. With each group, we estimated stimulus responses (beta weights) using the procedure described above (see the Image responses section) and computed object-averaged RDMs for each visual area. We used the correlation between the RDM from each of the two groups as our noise ceiling for percent explained variance estimates (Figure 6).”
However, Figure 6 and its legend don’t mention a noise ceiling. What is the noise ceiling in these analyses? Figure 2 would also benefit from noise ceilings for each of the brain areas. In addition, the split-half correlation should underestimate the noise ceiling because half the data is used and both RDMs are affected by noise. The noise ceiling computation should instead give an estimate of the expected performance of a noiseless true model or upper and lower bounds on this performance (Nili et al. 2014, Khaligh-Razavi & Kriegeskorte 2015).
(8) What is the function of the two branches of the model?
Clarify the function of the two branches of the model in the legend of Figure 5 and in the methods section. A single GPU was used for training here. Did this serve to keep the architecture consistent with Krizhevsky et al. (2012)?
(9) Why are the ROIs so big?
As far as I remember, a normal size for LO or FFA is below 1 ml. LO1, LO2, and FFA have 234, 299, and 292 voxels (pooled across two subjects), corresponding to 3 to 4 ml on average across subjects (given that voxels were 3 mm isotropic).
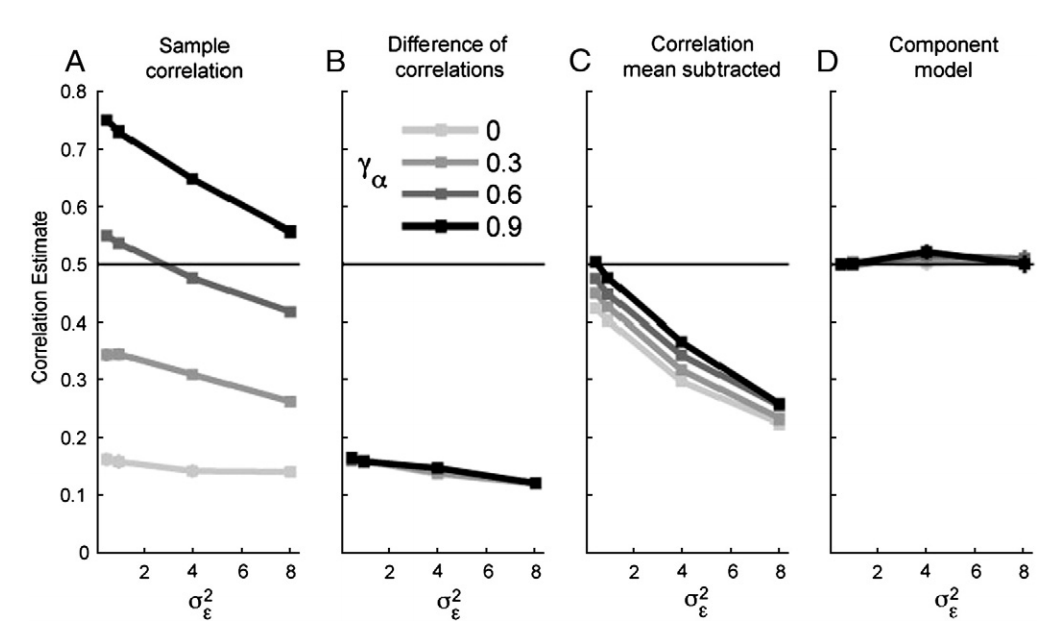
(10) Add a colour legend to Figure 4
This would help the reader quickly understand the meaning of the lines without having to refer to the text description.