[I3R3]
Bobadilla-Suarez, Ahlheim, Mehrotra, Panos, & Love (pp2018) set out to shed some light on the best choice of similarity measure for analyzing distributed brain representations. They take an empirical approach, starting with the assumption that a good measure of neural similarity should reflect the degree to which an optimal decoder confuses two stimuli.
Decoding indeed provides a useful perspective for thinking about representational dissimilarities. Defining decoders helps us consider explicitly how other brain regions might read out a representation, and to base our analyses of brain activity on reasonable assumptions.
Using two different data sets, the authors report that Euclidean and Mahalanobis distances, respectively, are most highly correlated (Spearman correlation across pairs of stimuli) with decoding accuracy. They conclude that this suggests that Euclidean and Mahalanobis distances are preferable to the popular Pearson correlation distance as a choice of representational dissimilarity measure.
Decoding analyses provide an attractive approach to the assessment of representational dissimilarity for two reasons:
- Decoders can help us test whether particular information is present in a format that could be directly read out by a downstream neuron. This requires the decoder to be plausibly implementable by a single neuron, which holds for linear readout (if we assume that the readout neuron can see a sufficient portion of the code). While this provides a good motivation for linear decoding analyses, we need to be mindful of a few caveats: Single neurons might also be capable of various forms of nonlinear readout. Moreover, neurons might have access to a different portion of the neuronal information than is used in a particular decoding analysis. For example, readout neurons might have access to more information about the neuronal responses than we were able to measure (e.g. with fMRI, where each voxel indirectly reflects the activity of tens or hundreds of thousands of neurons; or with cell recordings, where we can often sample only tens or hundreds of neurons from a population of millions). Conversely, our decoder might have access to a larger neuronal population than any single readout neuron (e.g. to all of V1 or some other large region of interest).
- Decoding accuracy can be assessed with an independent test set. This removes overfitting bias of the estimate of discriminability and enables us to assess whether two activity patterns really differ without relying on assumptions (such as Gaussian noise) for the validity of this inference.
This suggests using decoding directly to measure representational dissimilarity. For example, we could use decoding accuracy as a measure of dissimilarity (e.g. Carlson et al. 2013, Cichy et al. 2015). The paper’s rationale to evaluate different dissimilarity measures by comparison to decoding accuracy therefore does not make sense to me. If decoding accuracy is to be considered the gold standard, then why not use that gold standard itself, rather than a distinct dissimilarity measure that serves as a stand in?
In fact the motivation for using Pearson correlation distance for comparing brain-activity patterns is not to emulate decoding accuracy, but to describe to what extent two experimental conditions push the baseline activity pattern in different directions in multivariate response space: The correlation distance is 1 minus the cosine of the angle the two patterns span (after the regional-mean activation has been subtracted out from each).
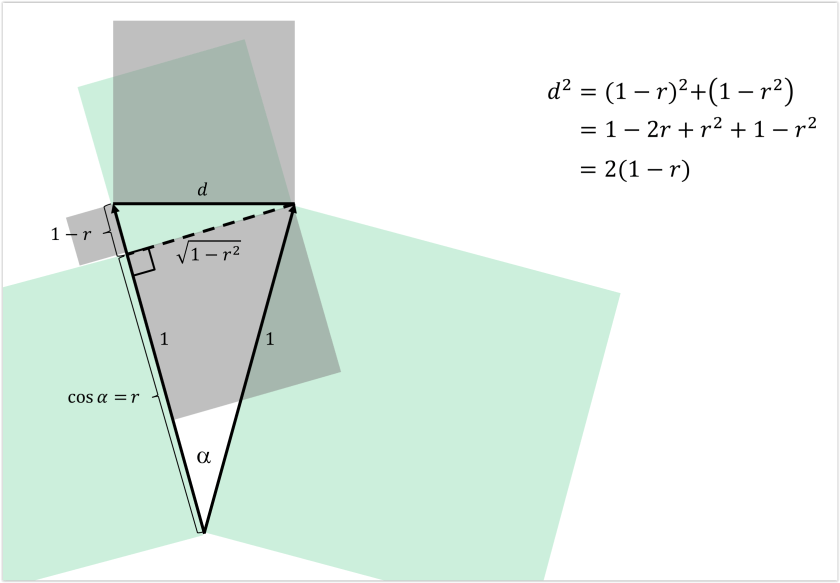
Interestingly, the correlation distance is proportional to the squared Euclidean distance between the normalized patterns (where each pattern has been separately normalized by first subtracting the mean from each value and then scaling the norm to 1; see Fig. 1, below and Walther et al. 2016). So in comparing the Euclidean distance to correlation distance, the question becomes whether those normalizations (and the squaring) are desirable.
One motivation for removing the mean is to make the pattern analysis more complementary to the regional-mean activation analysis, which many researchers standardly also perform. Note that this motivation is at odds with the desire to best emulate decoding results because most decoders, by default, will exploit regional-mean activation differences as well as fine-grained pattern differences.
The finding that Euclidean and Mahalanobis distances better predicted decoding accuracies here than correlation distance, could have either or both of the following causes:
- Correlation distance normalizes out to the regional-mean component. On the one hand, regional-mean effects are large and will often contribute to successful decoding. On the other hand, removing the regional-mean is a very ineffective way to remove overall-activation effects (especially different voxels respond with different gains). Removing the regional mean, therefore, may hardly affect the accuracy of a linear decoder (as shown for a particular data set in Misaki et al. 2010).
- Correlation distance normalizes out the pattern variance across voxels. The divisive normalization of the variance around the mean has an undesirable effect: Two experimental conditions that do not drive a response and therefore have uncorrelated patterns (noise only, r ≈ 0) appear very dissimilar (1 – r ≈ 1). If we used a decoder, we would find that the two conditions that don’t drive responses are indistinguishable, despite their substantial correlation distance. This has been explained and illustrated by Walther et al. (2016; Fig. 2, below). Note that the two stimuli would be indistinguishable, even if the decoder was based on correlation distance (e.g. Haxby et al. 2001). It is the independent test set used in decoding that makes the difference here.
Normalizing each pattern (by subtracting the regional mean and/or dividing by the standard deviation across voxels) is a defensible choice – despite the fact that it might make dissimilarities less correlated with linear decoding accuracies (when the latter are based on different normalization choices). However, it is desirable to use crossvalidation (as is typically used in decoding) to remove bias.
The dichotomy of decoding versus dissimilarity is misleading, because any decoder is based on some notion of dissimilarity. The minimum-correlation-distance decoder (Haxby et al. 2001) is one case in point. The Fisher linear discriminant can similarly be interpreted as a minimum-Mahalanobis-distance classifier. Decoders imply dissimilarities, requiring the same fundamental choices, so the dichotomy appears unhelpful.
To get around the issue of choosing a decoder, the authors argue that the relevant decoder is the optimal decoder. However, this doesn’t solve the problem. Imagine we applied the optimal decoder to representations of object images in the retina and in inferior temporal (IT) cortex. As the amount of data we use grows, every image will become discriminable from every other image with 100% accuracy in both the retina and IT cortex (for a typical set of natural photographs). If we attempted to decode categories, every category would eventually become discernable in the retinal patterns.
Given enough data and flexibility with our decoder, we end up characterizing the encoded information, but not the format in which it is encoded. The encoded information would be useful to know (e.g. IT might carry less information about the stimulus than the retina). However, we are usually also (and often more) interested in the “explicit” information, i.e. in the information accessible to a simple, biologically plausible decoder (e.g. the category information, which is explicit in IT, but not in the retina).
The motivation for measuring representational dissimilarities is typically to characterize the representational geometry, which tells us not just the encoded information (in conjunction with a noise model), but also the format (up to an affine transform). The representational geometry defines how well any decoder capable of an affine transform can perform.
In sum, in selecting our measure of representational dissimilarity we (implicitly or explicitly) make a number of choices:
- Should the patterns be normalized and, if so, how?
This will make us insensitive to certain dimensions of the response space, such as the overall mean, which may be desirable despite reducing the similarity of our results to those obtained with optimal decoders. - Should the measure reflect the representational geometry?
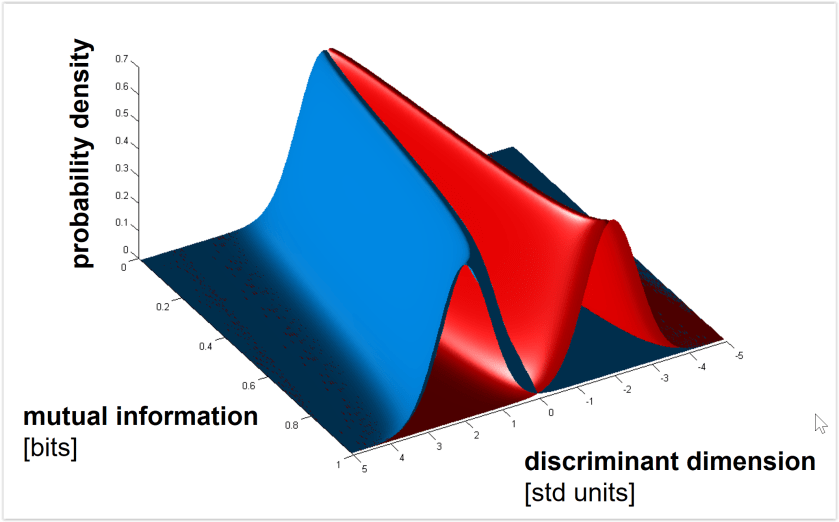
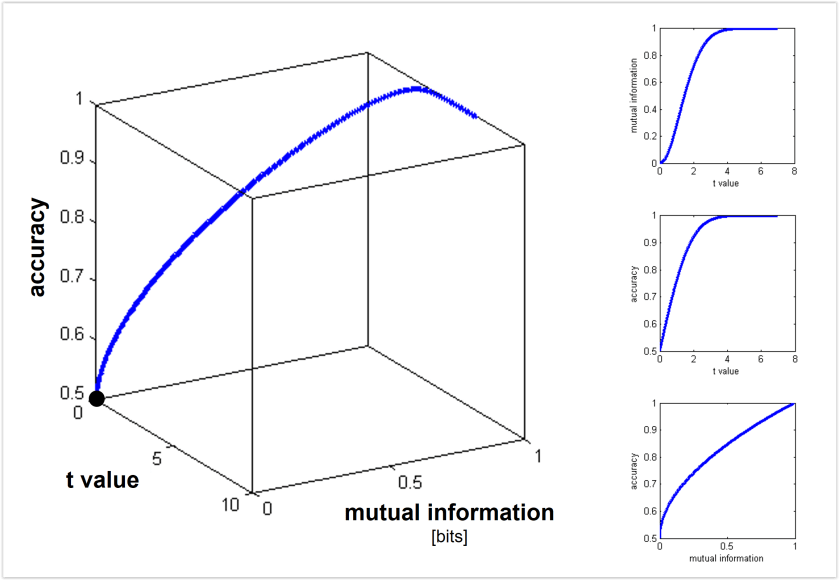
Euclidean and Mahalanobis distance characterize the geometry (before or after whitening the noise, respectively). By contrast, saturating functions of these distances such as decoding accuracy or mutual information (for decoding stimulus pairs) do not optimally reflect the geometry. See Figs. 3, 4 below for the monotonic relationships among distance (measured along the Fisher linear discriminant), decoding accuracy, and mutual information between stimulus and response. - Should we use independent data to remove the positive bias of the dissimilarity estimate?
Independent data (as in crossvalidation) can be used to remove the positive bias not only of the training-set accuracy of a decoder, but also of an estimate of a distance on the basis of noisy data (Kriegeskorte et al. 2007, Nili et al. 2014, Walther et al. 2016).
Linear decodability is widely used as a measure of representational distinctness, because decoding results are more relevant to neural computation when the decoder is biologically plausible for a single neuron. The advantages of linear decoding (interpretability, bias removal by crossvalidation) can be combined with the advantages of distances (non-quantization, non-saturation, characterization of representational geometry) and this is standardly done in representational similarity analysis by using the linear discriminant t (LD-t) value (Kriegeskorte et al. 2007, Nili et al. 2014) or the crossnobis estimator (Walther et al. 2016, Diedrichsen et al. 2016, Kriegeskorte & Diedrichsen 2016, Diedrichsen & Kriegeskorte 2017, Carlin et al. 2017). These measures of representational dissimilarity combine the advantages of decoding accuracies and continuous dissimilarity measures:
- Biological plausibility: Like linear decoders, they reflect what can plausibly be directly read out.
- Bias removal: As in linear decoding analyses, crossvalidation (1) removes the positive bias (which similarly affects training-set accuracies and distance functions applied to noisy data) and (2) provides robust frequentist tests of discriminability. For example, the crossnobis estimator provides an unbiased estimate of the Mahalanobis distance (Walther et al. 2016) with an interpretable 0 point.
- Non-quantization: Unlike decoding accuracies, crossnobis and LD-t estimates are continuous estimates, uncompromised by quantization. Decoding accuracies, in contrast, are quantized by thresholding (based on often small counts of correct and incorrect predictions), which can reduce statistical efficiency (Walther et al. 2016).
- Non-saturation: Unlike decoding accuracies, crossnobis and LD-t estimates do not saturate. Decoding accuracies suffer from a ceiling effect when two patterns that are already well-discriminable are moved further apart. Crossnobis and LD-t estimates proportionally reflect the true distances in the representational space.
Strengths
- The paper considers a wide range of dissimilarity measures (though these are not fully defined or explained).
- The paper uses two fMRI data sets to compare many dissimilarity measures across many locations in the brain.
Weaknesses
- The premise of the paper that optimal decoders are the gold standard does not make sense.
- Even if decoding accuracy (e.g. linear) were taken as the standard to aspire to, why not use it directly, instead of a stand-in dissimilarity measure?
- The paper lags behind the state of the literature, where researchers routinely use dissimilarity measures that are either based on decoding or that combine the advantages of decoding accuracies and continuous distances.
Major points
- The premise that the optimal decoder should be the gold standard by which to choose a similarity measure does not make sense, because the optimal decoder reveals only the encoded information, but nothing about its format and what information is directly accessible to readout neurons.
- If linear decoding accuracy (or the accuracy of some other simple decoder) is to be considered the gold standard measure of representational dissimilarity, then why not use the gold standard itself instead of a different dissimilarity measure?
- In fact, representational similarity analyses using decoder accuracies and linear discriminability measures (LD-t, crossnobis) are widely used in the literature (Kriegeskorte et al. 2007, Nili et al. 2014, Cichy et al. 2014, Carlin et al. 2017 to name just a few).
- One motivation for using the Pearson correlation distance to measure representational dissimilarity is to reduce the degree to which regional-mean activation differences affect the analyses. Researchers generally understand that Pearson correlation is not ideal from a decoding perspective, but prefer to choose a measure more complementary to regional-mean activation analyses. This motivation is inconsistent with the premise that decoder confusability should be the gold standard.
- A better argument against using the Pearson correlation distance is that it has the undesirable property that it renders indistinguishable the case when two stimuli elicit very distinct response patterns and the case when neither stimulus drives the region strongly (and the pattern estimates are therefore noise and uncorrelated).

3 thoughts on “What’s the best measure of representational dissimilarity?”